The origins of winds and atmospheric pressure
One square metre (1 m2) of the Earth’s surface on or near the equator receives more solar radiation per year than 1 m2 at higher latitudes. Because of the curve of the earth the angles mean that the sound rays have further to travel with increased latitude so areas such as the tropics are hotter than the areas of higher latitude.
With these temperature variances it means that there will be differences in atmospheric pressure which give rise to movements of atmospheric masses which is the principle behind
Atmospheric pressure - It’s the pressure resulting from the weight of the column of air above a specified surface area. The unit of atmospheric pressure is the bar, measured using a barometer – usually calibrated in millibars (mbar), i.e. thousandths of a bar.
On a weather map the regions marked ‘high’ and ‘low’ relate to the atmospheric pressure and the contours represent lines of equal pressure called isobars. The high-pressure regions tend to indicate fine weather with little wind, whereas the low-pressure regions indicate changeable windy weather and precipitation (rain or snow).
Energy and wind power
The energy contained in the wind is its kinetic energy, and in accordance with basic physical principles the kinetic energy of a moving mass (moving air in this case) is equal to half the mass, m, (of the air) times the square of its velocity, V:
 Wind turbines
There are two types of wind turbines:
Horizontal axis wind turbines (HAWTs)
These can be muti bladed and have been used since the 19th century for water pumping. Modern turbines have 2 or 3 blades and work at much higher rotational speeds making them great for electricity generation. They go from small turbines to massive turbines producing 7.5 MW or more.
Vertical axis wind turbines (VAWTs)

The shape of wind turbines is important as an object in an air stream experiences a force from the air stream that is equivalent to two component forces at right angles - drag force and lift force.

V = Velocity, L = Lift force, F = force, D = Drag force
An object in an air stream is subject to a F and this is composed of D which is acting in one with the sir flow direction and the L which is acting at 90 degrees to the direction of the air flow. L and D forces are both proportional tot he energy in the wind. In HAWTs the rotational axis is maintained in line with the wind direction by a 'yawning' mechanism which constantly realigns the turbine. In a VAWT, the wind direction constantly changes through its cycle and therefore the 'suction' side reverses during each cycle.
Calculating the power and energy from wind turbines
The power output of a wind turbine varies with wind speed. The energy it produces depends on its wind speed curve (image below) and the wind speed frequency distribution.

The wind speed distribution at a site is measures using equipment to record the number of hours for which the wind speed lies within a 1 metre per second (1 ms-1) band e.g. 0-1 ms-1 or 1-2 ms-1. The total energy produced in a given period is calculated by summing the energy produced at all wind speeds within the operating range of the turbine.
Wind speed maps, atlases and computer models
The Riso Laboratory in Denmark has produced various maps of various areas within the EU to show annual mean wind speed at 50 metres above ground level for five different topographical conditions.

Positive impacts of wind energy
The generation of electricity by wind turbines does not involve:
- the real ease of carbon dioxide
- pollutants that cause acid rain or smog
- radioactivity
- contamination of land, sea or water courses
- the consumption of water
Large scale implementation of wind energy within the UK would probably be one of the most economic and rapid means of reducing carbon dioxide emissions.
Environmental concerns
Noise
Wind turbines are often described as noisy but they are not companies with other machines.

The noise can easily be reduced by using acoustic enclosures for the machinery and also using slower rotational speeds to reduce aerodynamic noise.
Electromagnetic interference
If turbines are located between some types of radio transmitter, sometimes electromagnetic interference can occur because of the replication of some of the waves. This depends mainly on the turbine blade construction and surface shape.
Aviation
The MOD have expressed concerns about interference with military radar from turbines in low flying areas. Turbine blades are now being adapted to include radar absorbing materials.
Wildlife
Natural England suggests there is little evidence that wind farms in Enlgand have a significant impact on birds, but it provides guidance about wind turbines and birds, and post-construction monitoring of bird impacts.
For offshore wind there are concerns about possible impacts on fish, crustaceans, marine mammals, marine birds and migratory birds. Research it ongoing.
Wind turbines may have an impact on bats. Natural England has produced guidance to help planners and operators take account of potential impacts on bats when assessing wind turbine developments.
Public attitudes and planning
Wind turbines are not as big as people believe. Since the 1990s, on average 80-80% of the public support the development of wind farms in the UK but it is important that the planners work closely with local communities. There are a variety of factors which affect the public opinion of the turbines and this ranges from the types of blades and the number of blades to where the turbines are located and how many there are.
Offshore wind energy
In 2014, the UK had the world's largest offshore wind energy capacity to date - we had 3600 MW of offshore wind energy capacity installed from 1000 turbines.The cost of offshore wind farms is currently higher due to engineering costs, electrical connection costs and the need to construct the turbines out of more expensive materials which can withstand the corrosive nature of the sea.
Offshore wind speeds are higher and more consistent than on land so as technology is advancing and experience gained, offshore wind farms are becoming popular and the energy costs are competitive in the medium to long term.
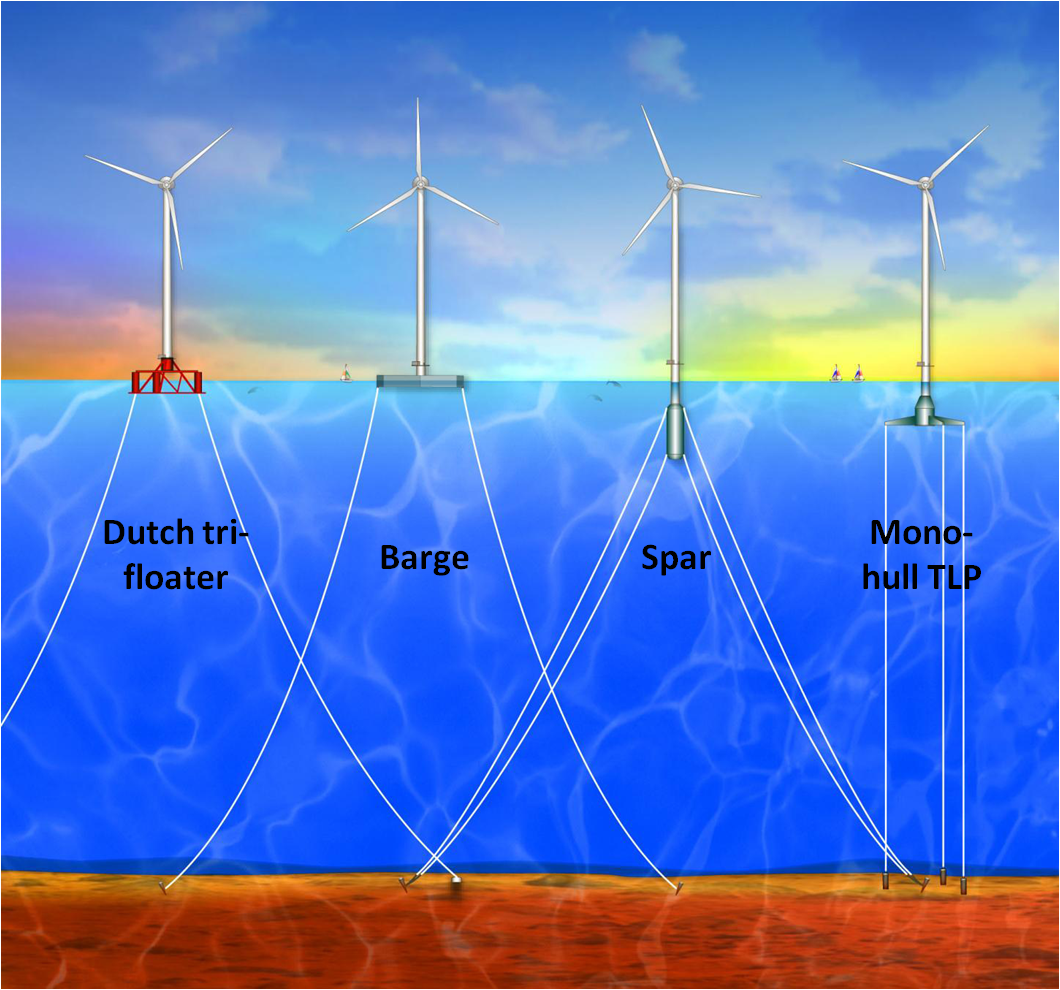
Floating wind turbines are being explored such as those below in order to locate turbines further out to sea as opposed to sitting on the shallow continental shelf.
Future prospects for wind energy
Wind energy looks set to be a major generator of electricity throughout the world. In Europe, the capturing of offshore wind energy is fat becoming on e of the most important means of reducing carbon dioxide emissions from the energy sector.
A European Commission report states:
With additional research efforts, and crucially, significant progress in building the necessary grid structure over the next ten years, wind energy could meet one fifth of the EU’s electricity demand in 2020, one third in 2030 and half by 2050 (Zervos and Kjaer, 2009).
References.
Beurskens, J. and Jensen, P. H. (2001) ‘Economics of wind energy – Prospects and directions’, Renewable Energy World, July–Aug.
Everett, B., Boyle, G. A., Peake S. and Ramage, J. (eds) (2012) Energy Systems and Sustainability: Power for a Sustainable Future (2nd edn), Oxford, Oxford University Press/Milton Keynes, The Open University.
EWEA (1991) Time for Action: Wind Energy in Europe, European Wind Energy Association.
Natural England (2009a) Technical Information Note TIN051: Bats and onshore wind turbines – Interim guidance, First Edition, February.
Natural England (2009b) Technical Information Note TIN059: Bats and single large wind turbines: Joint Agencies interim guidance, First Edition, September.
NOP (2005) Survey of Public Opinion of Wind Farms, NOP for BWEA, UK.
Risø (2009) European wind resources over open sea, http://www.windatlas. dk/europe/oceanmap.html.
Troen, I. and Petersen, E. L. (1989) European Wind Atlas, Risø, Denmark for the Commission of the European Communities.
YouGov (2010) Public Attitudes to Wind Farm YouGov Survey, YouGov plc for Scottish Renewables.
Zervos, A and Kjaer, C. (2009) Pure Power – Wind energy targets for 2020 and 2030. (2009 update). European Wind Energy Association.

